…if you are frustrated with reporting in Excel (and you should be!)
Recently
(Feb 21) the leading research company Gartner published its annual survey on
Business Intelligence ("BI") applications.
For
those not familiar with this term, think 'visual dashboards' and 'analytical
tools' based upon 'structured data'.
Many
companies I speak with have a hunger for that kind of presentation. But most
are still trying to muddle along in Microsoft Excel with cell formulae and
charts for their management reporting because that's what their people know.
However,
BI solutions, once the preserve of larger corporations with large IT teams and
budgets, are a realistic and useful proposition for small and medium-sized
enterprises too.
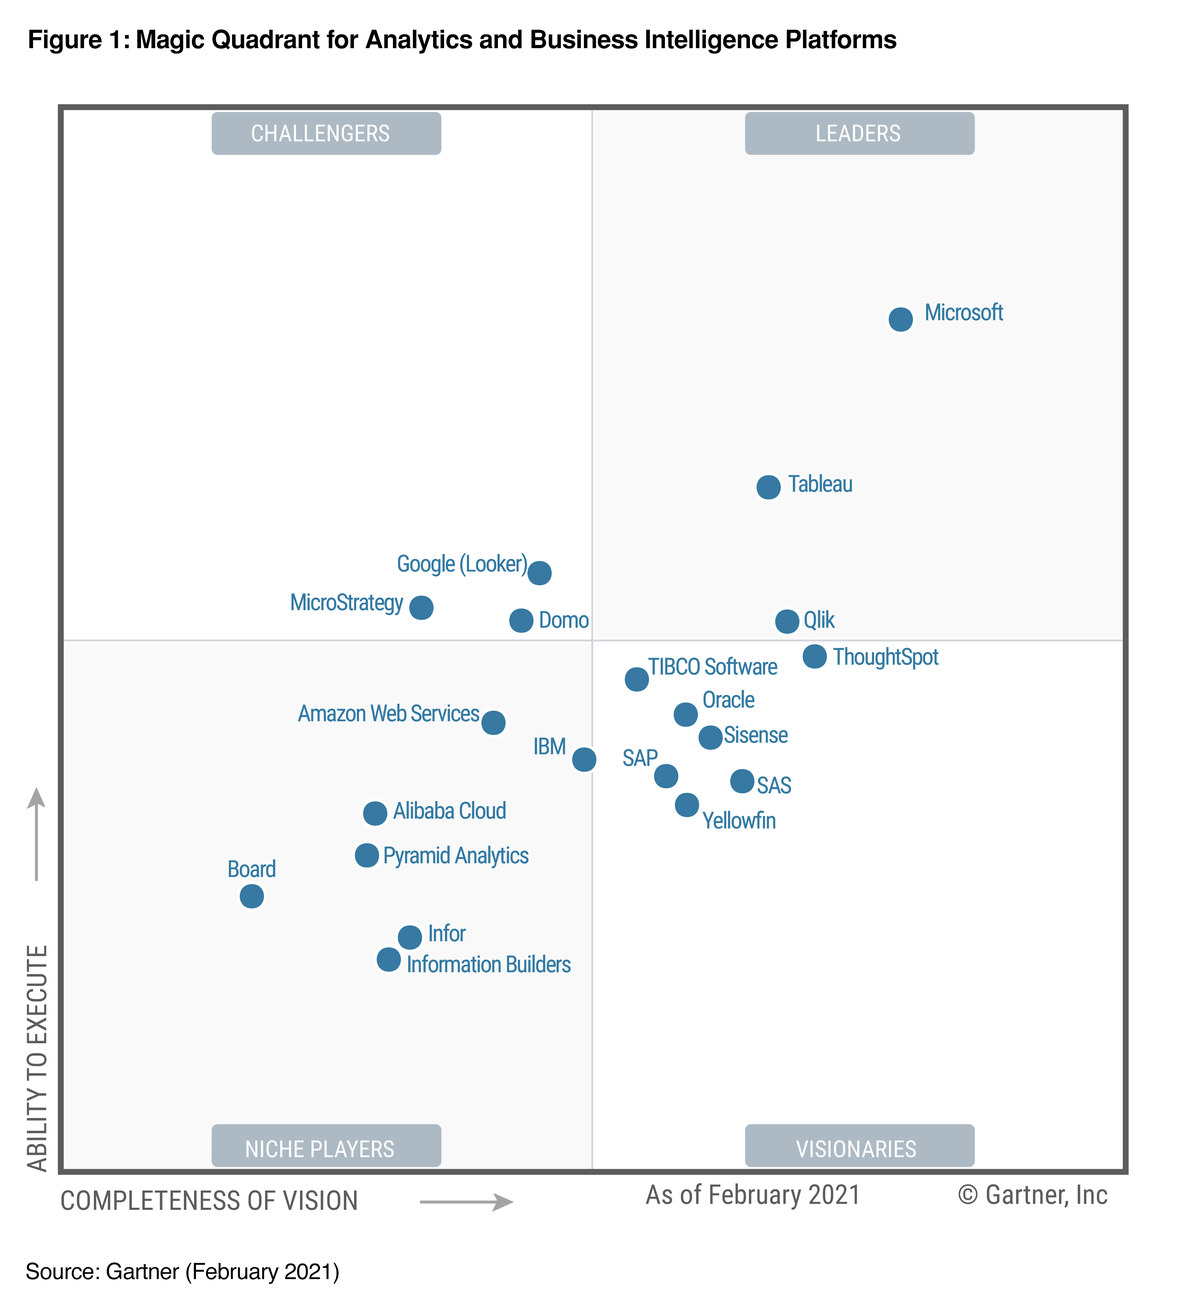
Gartner's
research (see the chart below) showed that among the major providers of BI solutions,
Microsoft's Power BI platform is the stand-out leader in terms of the ability to
execute a solution and the completeness of the vision of the product.
If you haven't already got a BI solution as part of your management reporting I'm going to give you five reasons why you need to start a journey to explore what Microsoft Power BI can do for you.
Reason #1 - Excel is everywhere… but
Power BI is more robust
Despite billions spent on IT systems across the globe, most organisations still have some dependency on spreadsheet solutions. I once heard that the head of the oil giant BP, when asked what Enterprise Accounting system they used, replied "Excel" - with only a mild sense of irony…
Most of the time that works, but we've all heard horror stories of corporate and governmental embarrassment caused by dodgy cell formulae and missing rows of data.
Thankfully that isn't the experience of every organisation.
But I hypothesise that every organisation that uses Excel produces a raft of management reports using Excel - tables, charts etc, which are then emailed out. In the main that works fine, but costs the organisation (especially the finance department) a lot of time and 'pushes' data at increasingly overwhelmed people, rather than allowing them to 'pull' it when they need it.
The positive flipside of this is that we have a lot of people with Excel familiarity and skills.
With a little training, we can enhance those skills to encompass the kind of structured processing of data that Business Intelligence demands, using the native features of the latest generation of Excel. (I'm working with clients right now on my Accelerator Programme
who are being BLOWN AWAY by the benefits of swapping their cell formulae for Excel queries!).
Working with the Power BI data tools can save huge
amounts of processing time.
And Power BI and Excel share the same underlying data-processing architecture.
So, everything users learn in Excel can be fast-tracked into Power BI solutions with a minimal learning curve. But Power BI is a much more robust reporting solution.
Reason #2 - It's free (at least to start)
Many software products claim to be free to trial so either you end up paying after an introductory period, or the free version has severe functionality limitations.
However, Microsoft Power BI Desktop is a fully functioning product that can be downloaded and used at no cost.
Indeed, I've created several Power BI solutions using only the free Desktop version. If you’re happy to either create PDF reports to share or to have users open files in their own Desktop app, then you do not need to pay Microsoft a penny!
Only when you want to scale the publication to your reports using a formal cloud server or into mobile apps do you need to start buying licences. And the chances are you don't need to change much from your Desktop development to make this work.
Even if you feel the need to upgrade to a full all-singing all-dancing enterprise version (see reason #4) the costs are extremely competitive.
You can deliver a lot of reporting benefits before you have to pay for Power BI
Reason #3 - It’s intuitive to use and you can produce actionable visual results quickly
Even if Reason #1 of ubiquitous Excel is not a big enough advantage, Power BI makes dragging, dropping and modifying data visualisations relatively easy and the graphical capabilities significantly outstrip Excel.
Intuitive wisdom and a large number of academic studies show that when data is visualised, it helps our brains interpret what’s going on, which in turn leads us to discern patterns and extrapolate actions.
As with any product, there's always a learning curve, but anyone who has used PowerPoint, Word or Excel to produce presentations or reports will be at home with the visualisation concepts and the menus.
Beyond the technical data visuals, It's easy to add other graphics (Logos, shapes and images) and, unlike Excel, it's not a faff to produce something that fills the dimensions of a printed (or viewed on-screen) page.
Quality of presentation helps build confidence in the credibility of the data.
Anyone with average PC skills should be able to create Power BI visualisations that create professional-looking actionable insights. It's much quicker than Excel and more elegant.
Reason #4 - You can scale up to your enterprise quickly and inexpensively
InfoSuperstar
is a small consultancy operation - where I share my experience and wisdom in
management reporting and forecasting with business leaders and finance
professionals.
But
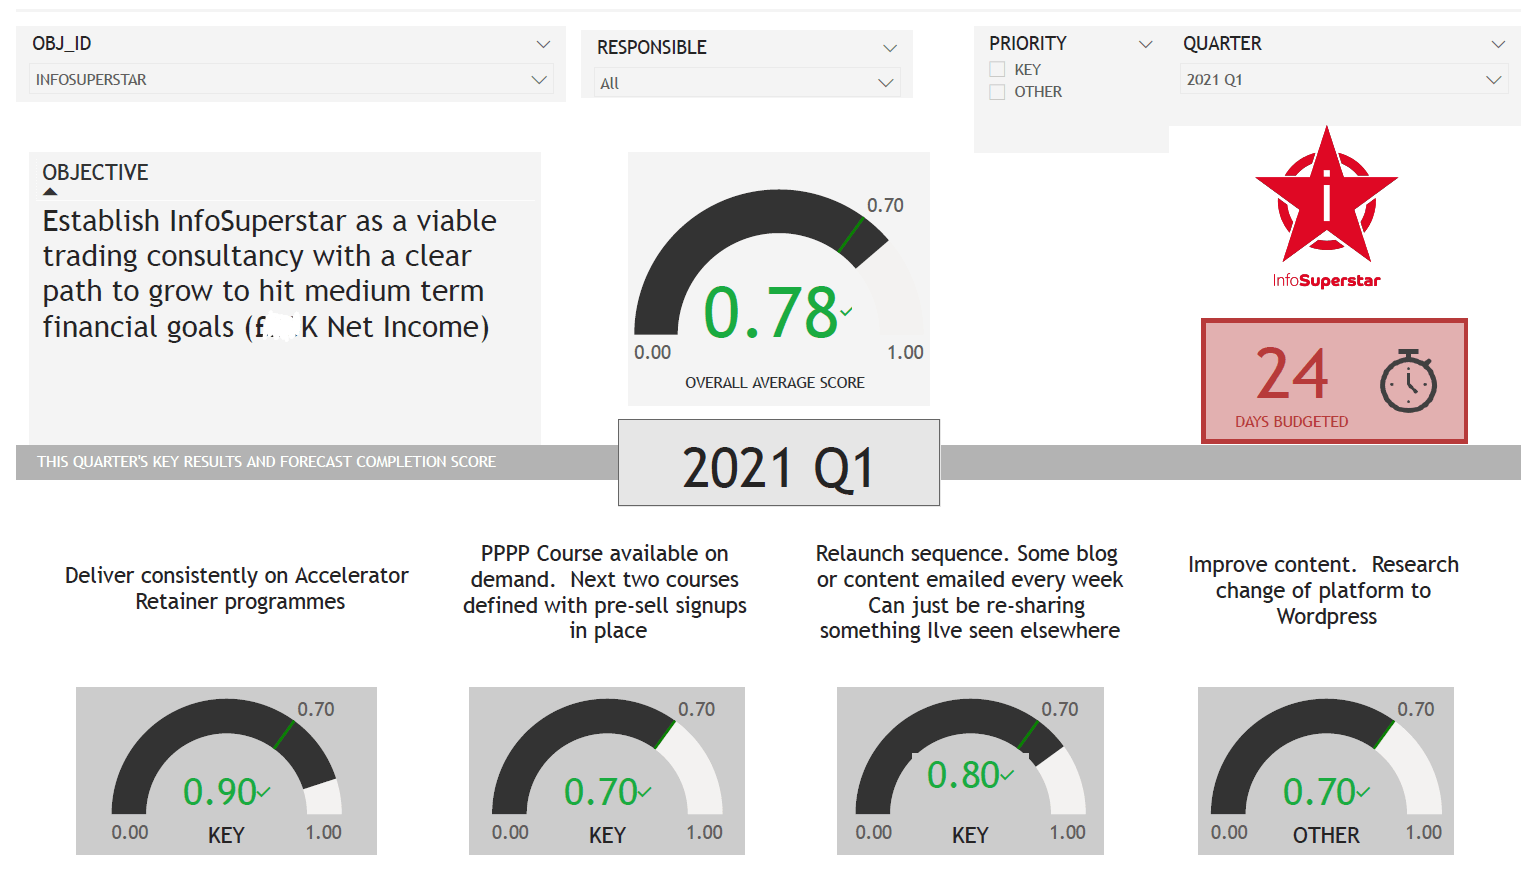
even as a 'One-man band' I find Power BI useful as a visualisation tool. I use
it to turn my Objectives and Key Results plans (data maintained in a
spreadsheet) into visual dashboards to remind me of how I'm doing on my
missional journey each quarter. I share this with my business coach. Here's my visual InfoSuperstar Dashboard for Q1 2021.
Power BI Desktop App implementations can be created by a single individual or a team. When ready, with the appropriate 'Pro' licence, publication and sharing of reports can happen with the click of a button.
At the time of writing, Microsoft's licencing model allows this to be scaled up, with a small initial investment in licences for publishers of cloud reports. This can be augmented by enterprise-wide fixed licencing to unlock all the cloud data processing of Azure Analytics services.
Whilst I’d always recommend the engagement of any organisation's IT department in making BI solutions work properly, deployment via Power BI can (and arguably should) utilise key users in all relevant departments, without using large amounts of (or any!) developer resource.
As a slight aside, I note that on a recent webinar, Microsoft’s CFO noted that they are expecting the trend for user function/app development to increase significantly, hence why they are putting a lot of resource behind their “Power” platform, which includes Power BI and Power Apps.
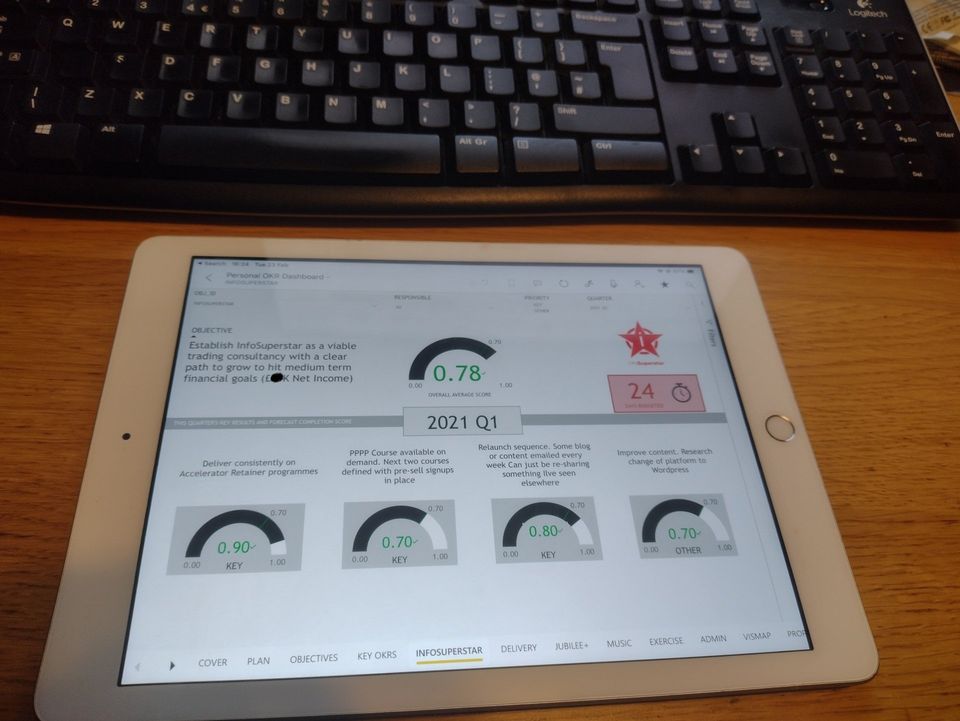
A desktop Power BI solution can become an enterprise-wide reporting solution with very little time or money. Excel just doesn’t do this.
As proof - It took me 5 minutes to upload/share to a server a mobile version of the above dashboard. This is real, not a photoshopped mock-up!
Reason #5 - It's Microsoft.. so it’s (probably) not going away
You can love them or hate them and I'm not a paid Microsoft fanboy. But the simple truth is that Microsoft are more or less everywhere in the business world and they have the financial muscle to push the development boundaries to ensure that the Power BI product improves and remains relevant.
I first played Power BI when it was in Beta version back in 2012/13. Quite frankly it sucked. Its back-end data-handling capability was rudimentary and it's graphical capabilities were inferior to Excel. I’d been working on a global BI project for a US company and PowerBI was never discussed as a shortlist candidate.
But Microsoft has plugged away, listening to customer needs and buying up small innovative companies like Datazen who were producing stunning visualisations based upon server data.
And gradually, like the way of the spreadsheet world where Excel grew to complete with and outpace Lotus 123 (remember that!), their major investment has created a world-leading product.
In parallel Microsoft has invested heavily in creating cloud server infrastructure with its Azure products.
Data analytics is only going to get bigger. Microsoft's BI and cloud data investment is a core part of its strategy and it has to resources to keep pace with any competitor, even Google.
Any investment you make in learning to use Power BI is unlikely to be undermined by the cessation of product support, and you stand to benefit from a growing functionality momentum.
So where do you go if you want to know more about Power BI?
Even you're not ready to sign up, why not book a free online coffee/chat with me to discuss your needs and interest?
[click here to book]
I’m a friendly guy and I don't do "sales" patter. Quite frankly, while we’re all in lockdown, human connection is nice! I’ve love to help get you started on Power BI without any obligation to sign up for any of my resources.
Until next time - adios amigos!
Andy Biggs